You can easily view the bandwidth and data traffic consumption of your server, and also download the graph data.
Contents
Graphs
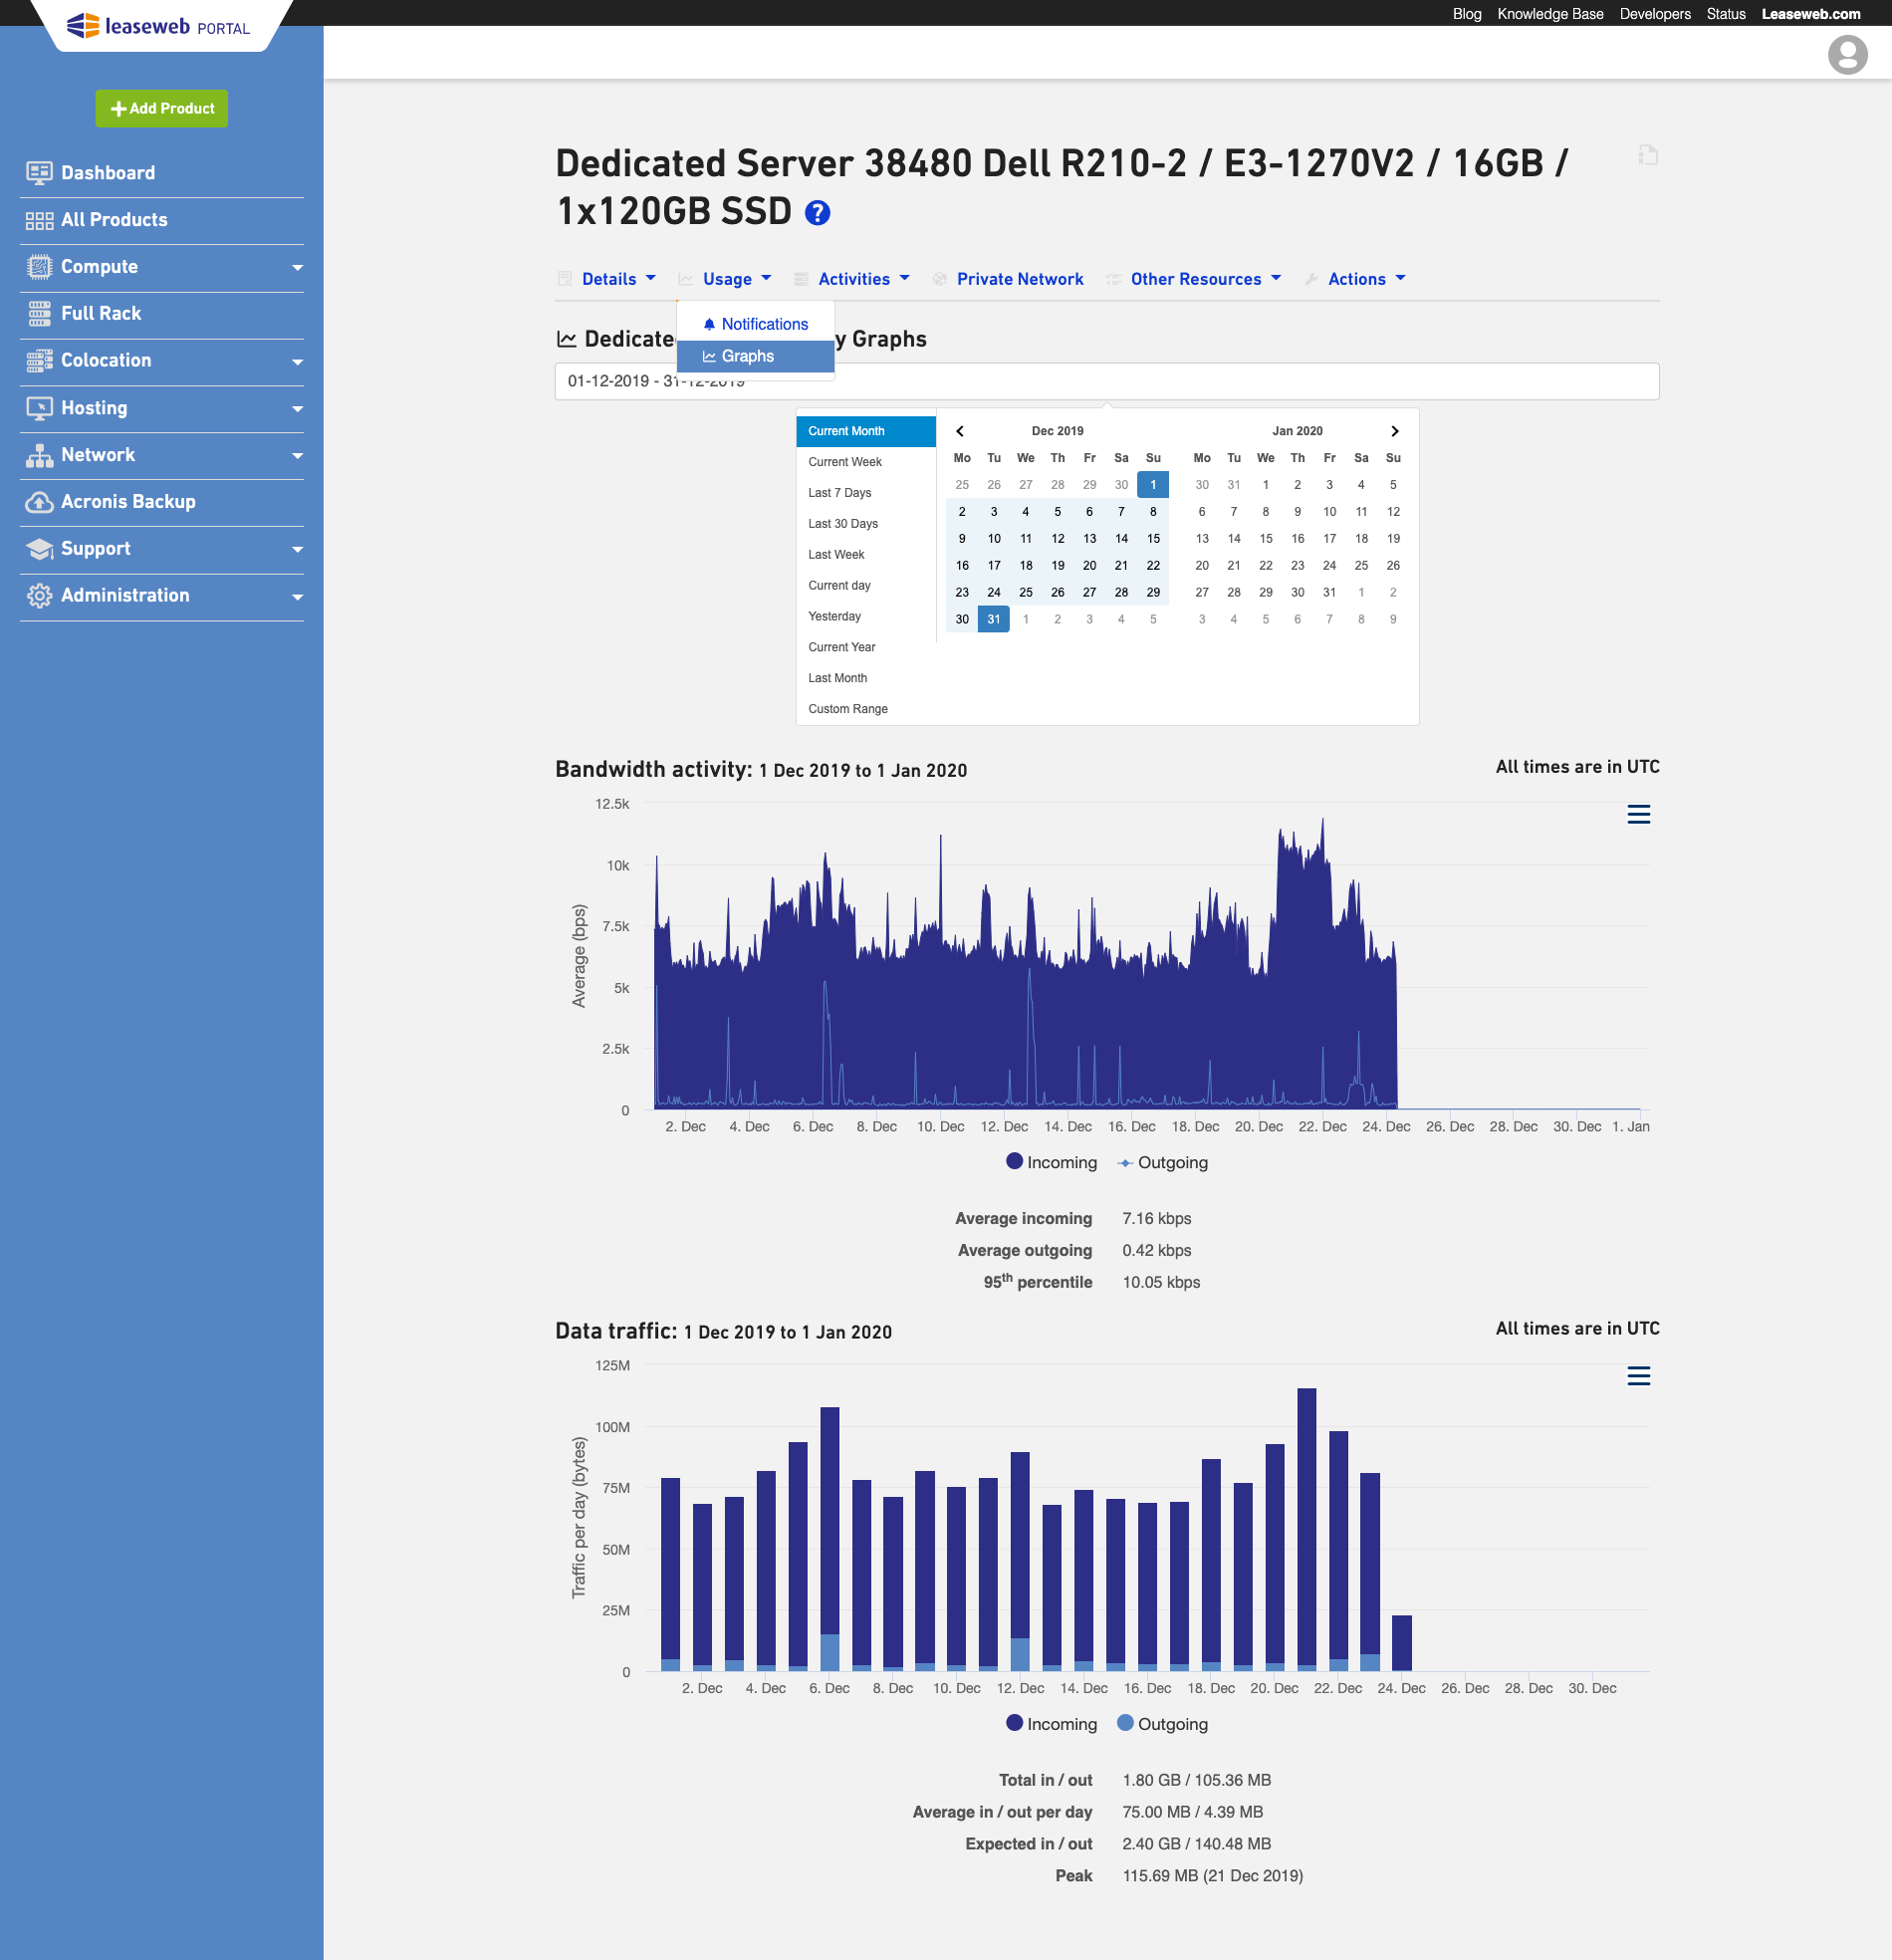
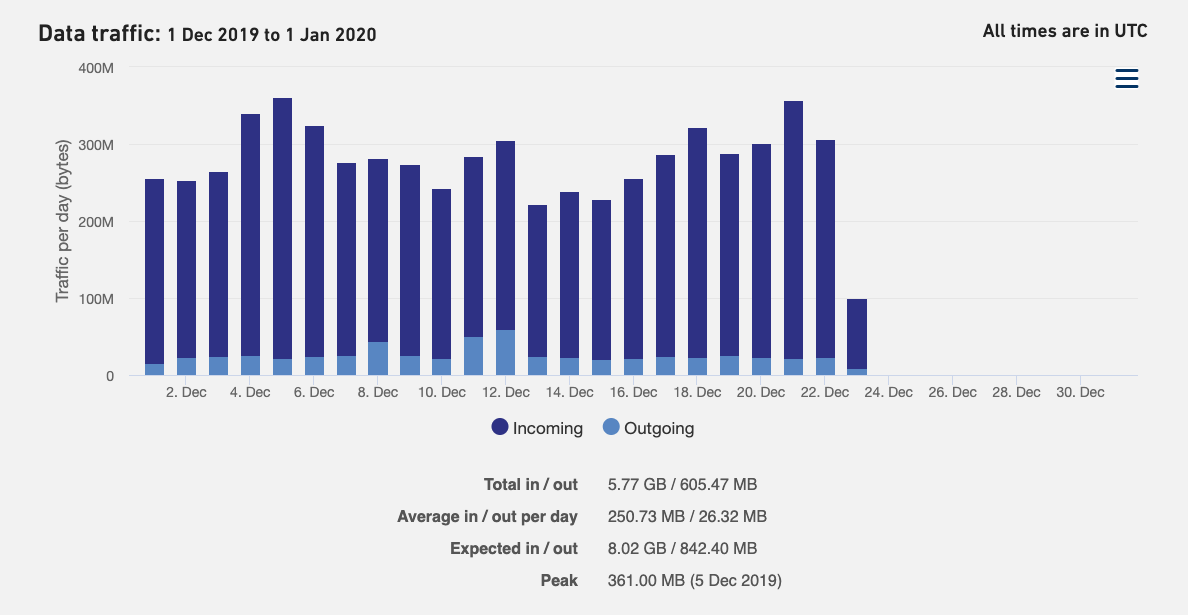
On the graphs page you can view the bandwidth activity and data traffic usage for your server.
By default the current month is shown.
To view a different period, you can:
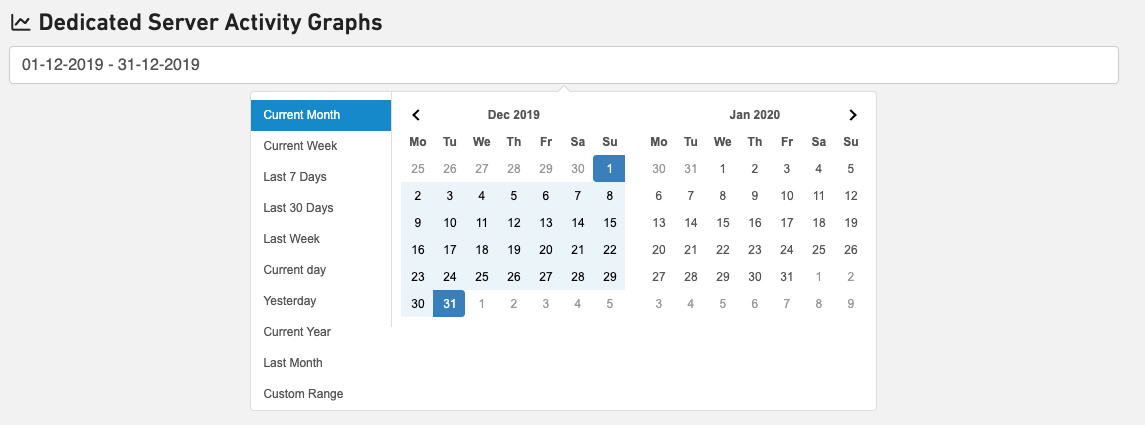
- Use the date picker at the top of the page
Note: the to: date is not included in the graph itself - Drag over the bandwidth activity graph to zoom in
By clicking on the ![]() icon you can:
icon you can:
- Print the chart
- Download the chart as a PNG image
- Download the chart as a JPEG image
- Download the chart as a PDF document
- Download the chart as a SVG vector image
Information
The data traffic chart and values are update once per day.
To select the timespan you would like to view information about, select the start and end date in the calendar located in the top left corner of the page.

The bandwidth and data traffic activity for the selected period of time appears in the graphs.
Bandwidth activity
Tip
For 95th percentile (burstable), you can have short bandwidth bursts, until you have reached the limits of your port speed. For example, if your commitment is 100 Mbps and you have a 1 Gbps port, for an average of 36 hours in the billing cycle, your bandwidth can go up to 1 Gbps without incurring any additional cost.
Data traffic activity

View expected usage of the current month
If you are using a data traffic billing model, you can view the expected usage of the current month. Based on this, you can predict if your server will incur a surcharge.
Information
| Field name | Description |
|---|---|
|
|
Click this icon in the top right corner of the activity graphs to download images of the graphs. Images are available in the formats: PNG, JPEG, PDF and SVG vector. |
|
|
To download a report of the activity graphs, select in which format you like to receive the report: JSON or CSV then click Download. |
Information
You can perform the same tasks on individual node’s bandwidth graph that you can perform on the aggregated bandwidth graph. This mainly involves viewing the 95th percentile, viewing graphs based on days or months, and downloading the bandwidth graph report in several formats.
Downloading raw graph data
To download raw graph data, you can perform API calls to the Dedicated Servers API. For more details please refer to the API documentation on developer.leaseweb.com
The API calls are:


