Instantly set up host and port monitoring tracking for your dedicated servers and virtual private servers in the Customer Portal with Monitoring.
Why monitoring? Every company has technology (such as servers, networks, equipment, and other devices) that is critical to running their business. These devices provide services to customers or clients on a technological level via a website, SaaS, PaaS or another service.
As a company, your services need to be provided in the same fashion as your business: day in and day out with little to no interruption. If something is wrong, you need to know before your clients and (ideally) have a fix in place before customers notice or are impacted.
Achieve this and more with Monitoring. Immediately detect malfunctions, choose what you want to monitor, and decide how in-depth you want to monitor different components.
Monitoring Setup
Information
Firewall setup
To make use of the Monitoring features, if you have your servers behind firewall protection, make sure you whitelist the following IP addresses:
| AMS-01 | 85.17.96.72 95.211.135.160 |
| LON-11 | 81.17.60.159 |
| LON-12 | 95.168.188.69 |
| FRA-01 | 212.95.49.40 |
| CHI-11 | 23.83.91.4 |
| NYC-11 | 108.62.49.141 |
| WDC-01 | 207.244.97.190 |
| SFO-12 | 209.58.140.8 |
| WDC-02 | 23.105.163.206 23.105.164.65 |
| MIA-11 | 23.82.136.9 |
| DAL-10 | 209.58.144.155 |
| SEA-11 | 23.19.87.144 |
| LAX-11 | 23.19.75.206 |
| PHX-11 | 23.83.129.213 |
| SIN-01 | 23.106.248.68 |
| SIN-11 | 209.58.177.146 |
| SYD-10 | 103.101.129.213 |
| HKG-10 | 209.58.191.198 |
| MTL-02 | 198.50.127.82 |
| TYO-10 TYO-11 | 198.50.127.82 |
In addition, you need to allow ICMP and TCP protocols from the IP Addresses above which are relevant to your location.
To set up Monitoring, go to the Details page of the dedicated server or virtual private server that you want to monitor.
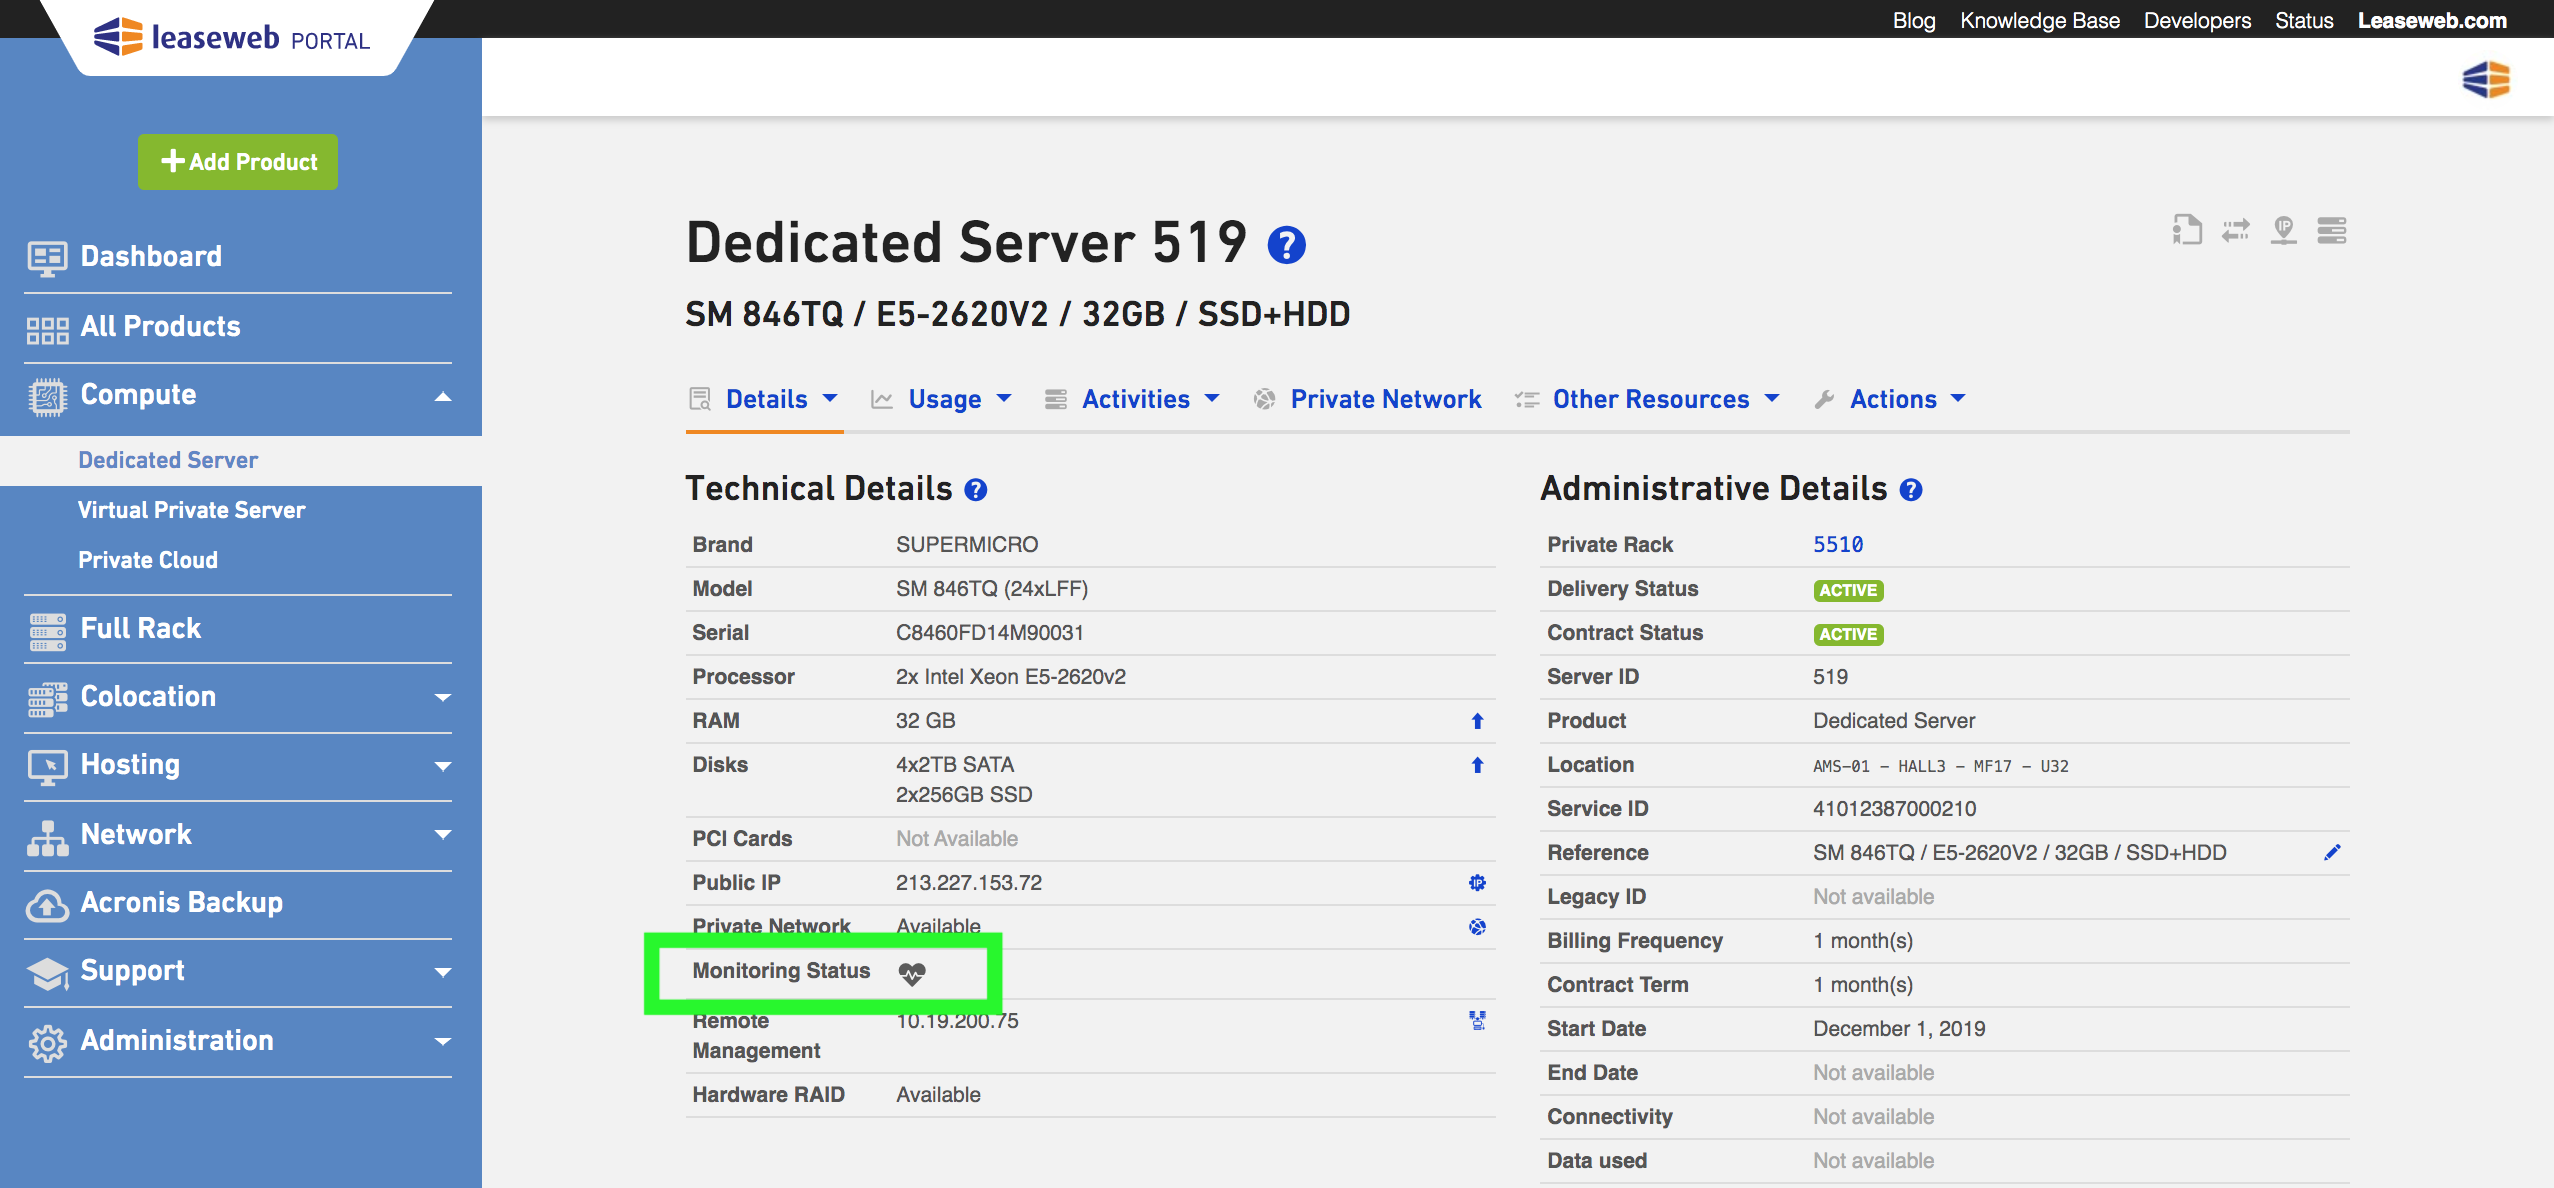
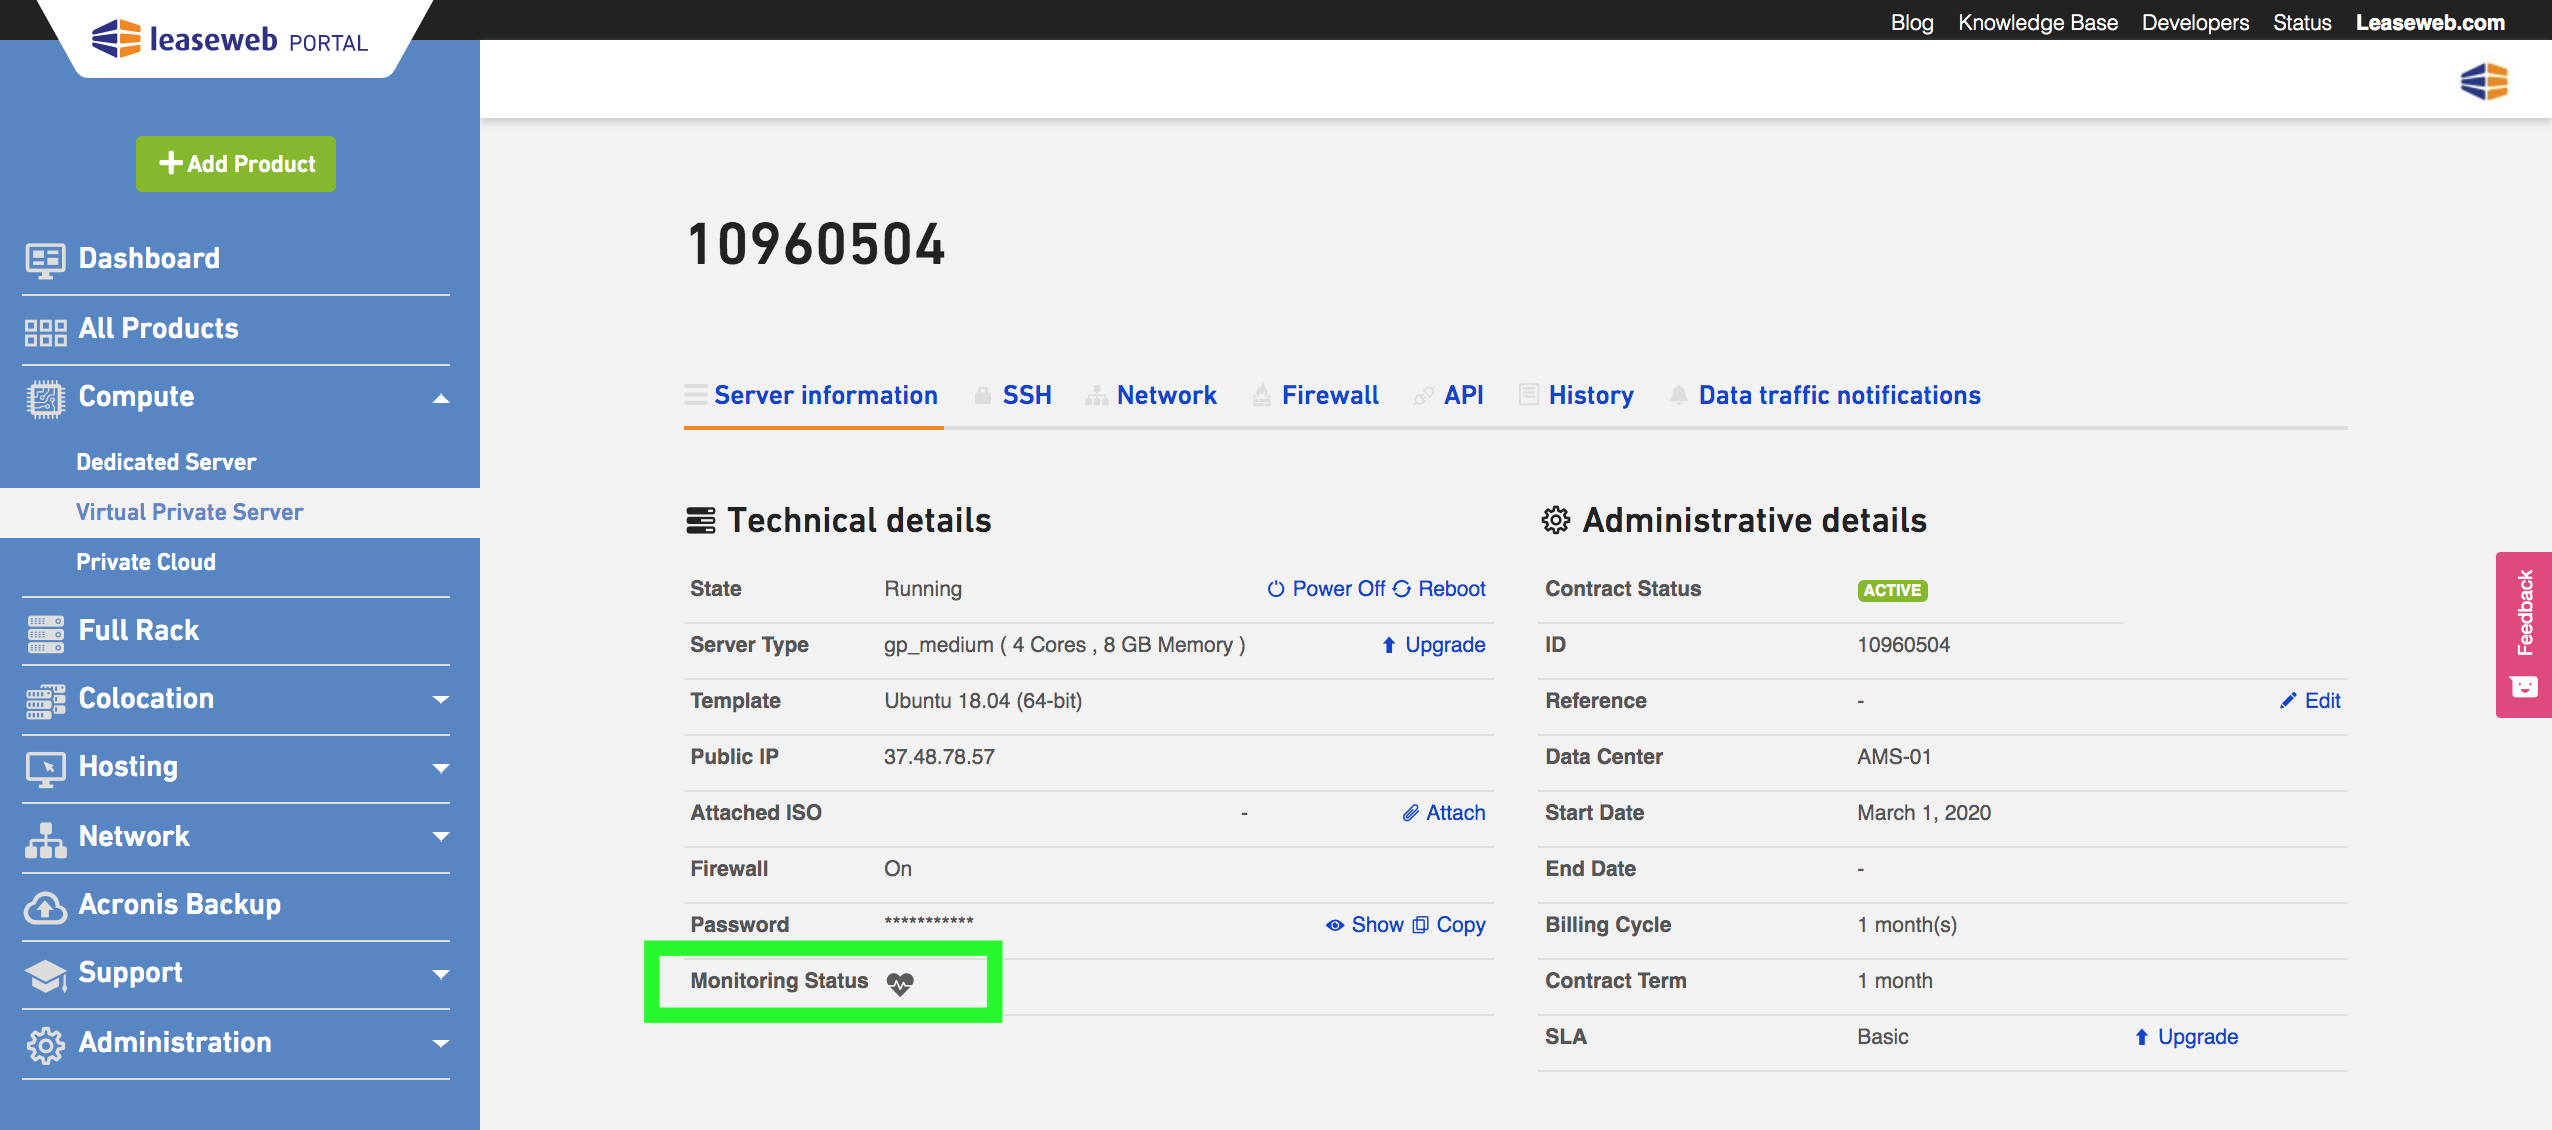
In the Monitoring Status attribute, the color of the heart icon indicates the monitoring status of the server:
- Black: no host is being monitored on this server.
- Green: monitored host is “Up”.
- Orange: monitored host is “Up”, but one or more services are “Down”.
- Red: monitored host is “Down”.
Enabling Monitoring
On the management page for the server you would like to monitor, click on the Monitoring Status icon. The monitoring widget will open:

Specify an IP Address to monitor from the available list, then click Start.
Information
After clicking Start, it can take up to five minutes for monitoring to be enabled for the host.
Host Details
When you click on the Monitoring Status icon for a server that has a host with monitoring enabled, the information for that host will be displayed on the monitoring widget.
Click the Refresh button at any time to reload and update the displayed information.
Stopping Monitoring
Click the Stop button at any time to remove monitoring from the host.
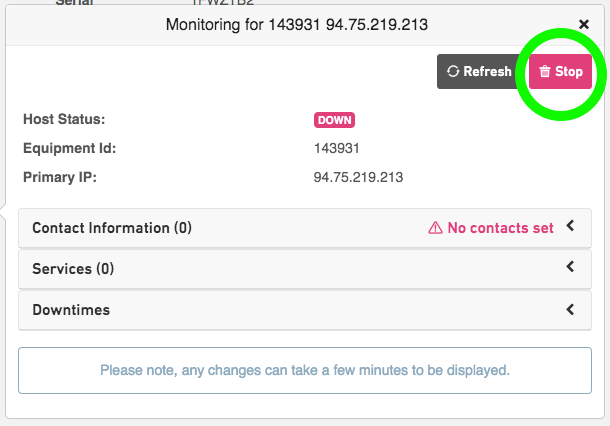
Information
All related configurations will be lost once monitoring for a host is stopped.
Enabling Notification
Monitoring can notify you by email when monitored hosts or services are down. To receive email alerts for failing checks:
- Click on the Contact Information tab. A list of all your registered technical contacts will be shown
- Select and mark the check-boxes for the email addresses on which you want to be notified for failing checks on this specific host and services

- Click on Save to apply your changes
Managing Monitoring for Services
Besides the host check, you can also add checks for specific services (HTTP, TCP) and ports.
- TCP check: Monitoring sends a command over TCP protocol to the specified port, and if it fails, an alert is triggered.
- HTTP check: Monitoring sends a command over HTTP protocol to the specified port, and if it fails, an alert is triggered.
To set up port checks on your host:
- Click on the Services tab. You will see a list of existing checks.

- Click on the + icon to add a service.
- Select the service and specify the port to be checked.
- Click on
 to add it to the list.
- You can remove a service by clicking on the
 icon next to it.
 - Click on Save to apply your changes.
Information
After clicking Save, it can take up to five minutes for the configuration to be applied.
Managing Downtimes
In the case, you want to suspend monitoring for a certain period (e.g.: for a scheduled maintenance or a reboot of your server), Monitoring has the option for configurable downtimes.
To set up downtimes on your host:
- Click on the Downtimes tab. You will see a list of existing planned downtimes

- To schedule a downtime, click on the + icon
- Specify a start and end date/time

- You can also add a comment for each downtime
- To remove a scheduled downtime, click on the X icon next to it
Monitoring Overview
Keep track of your monitored hosts and services with the Monitoring dashboard in the Customer Portal.
Accessing the Monitoring dashboard
On the left menu of the Customer Portal homepage, in the Support drop-down, click on the Monitoring link.
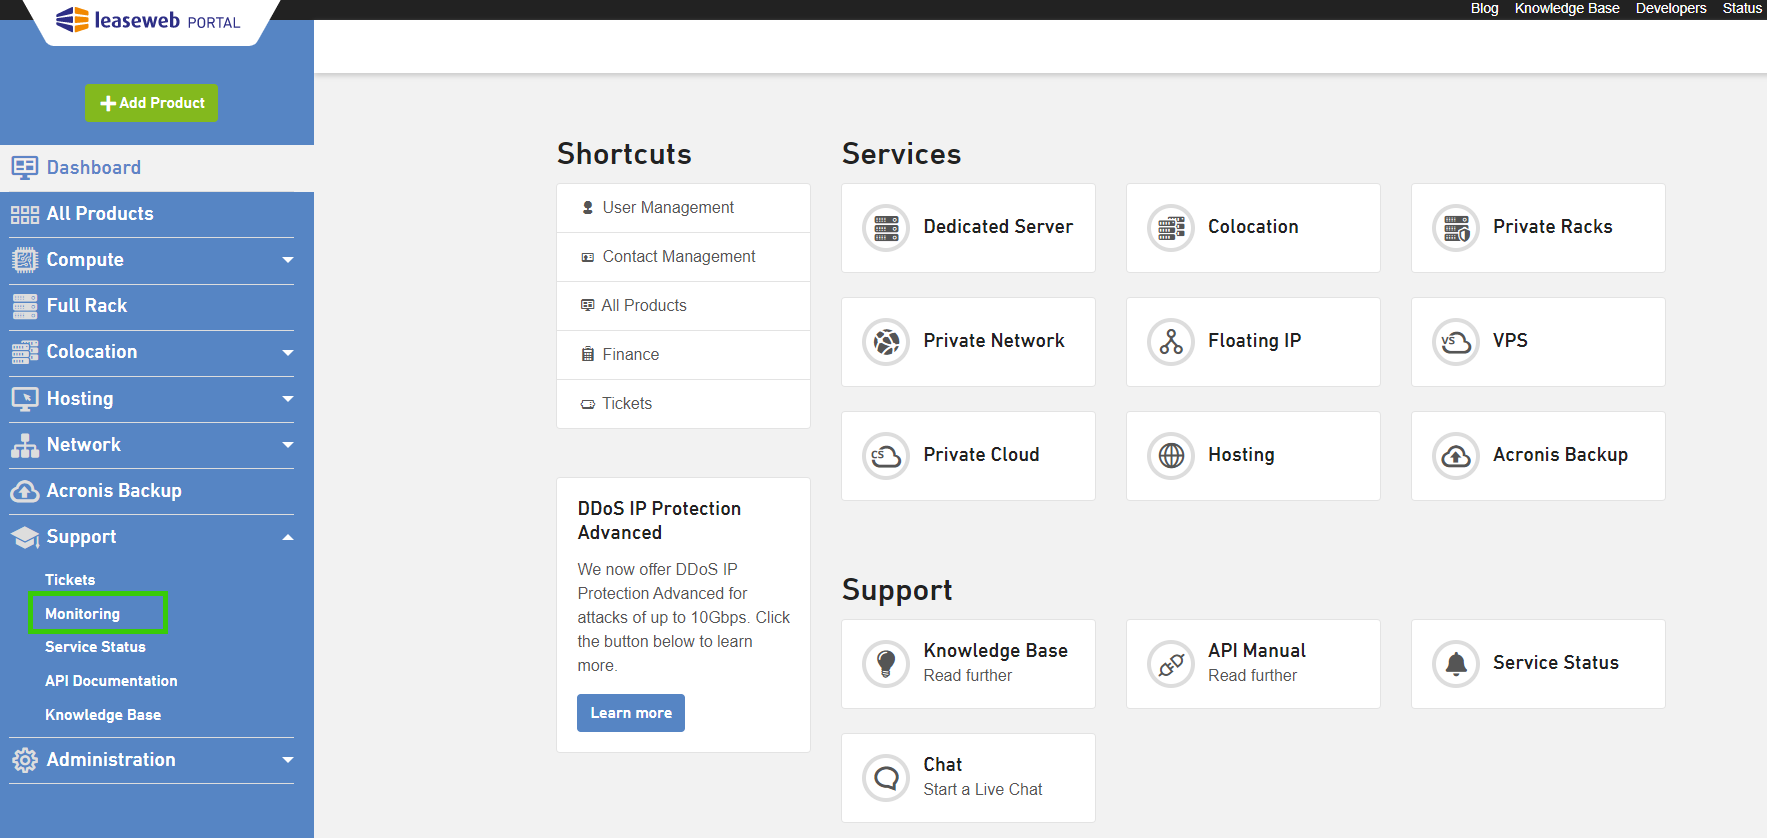
The Monitoring dashboard will load.
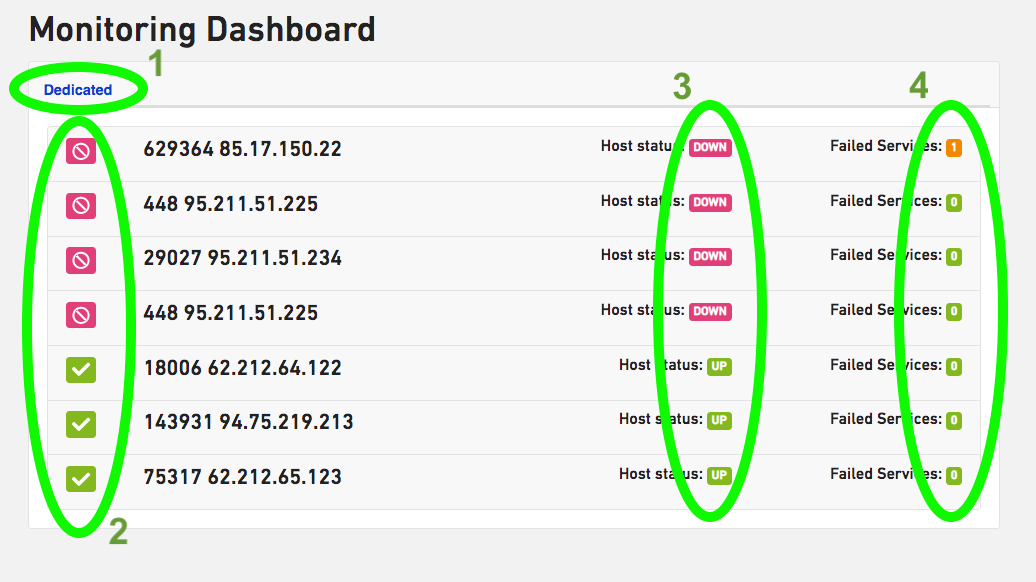
- Product tabs: filter on each type of product for which you have enabled monitoring (Dedicated and Virtual Private Servers are available now, with more options to come in the future).
- Host identification: each host is identified by a combination of its equipment ID followed by the monitored IP address.
- Host status: “Up” or “Down”, based on ping checks.
- Failing services count: the number of failing monitored services on a given host.
Click on a row (host) to expand it and retrieve details about the monitored services on that host:
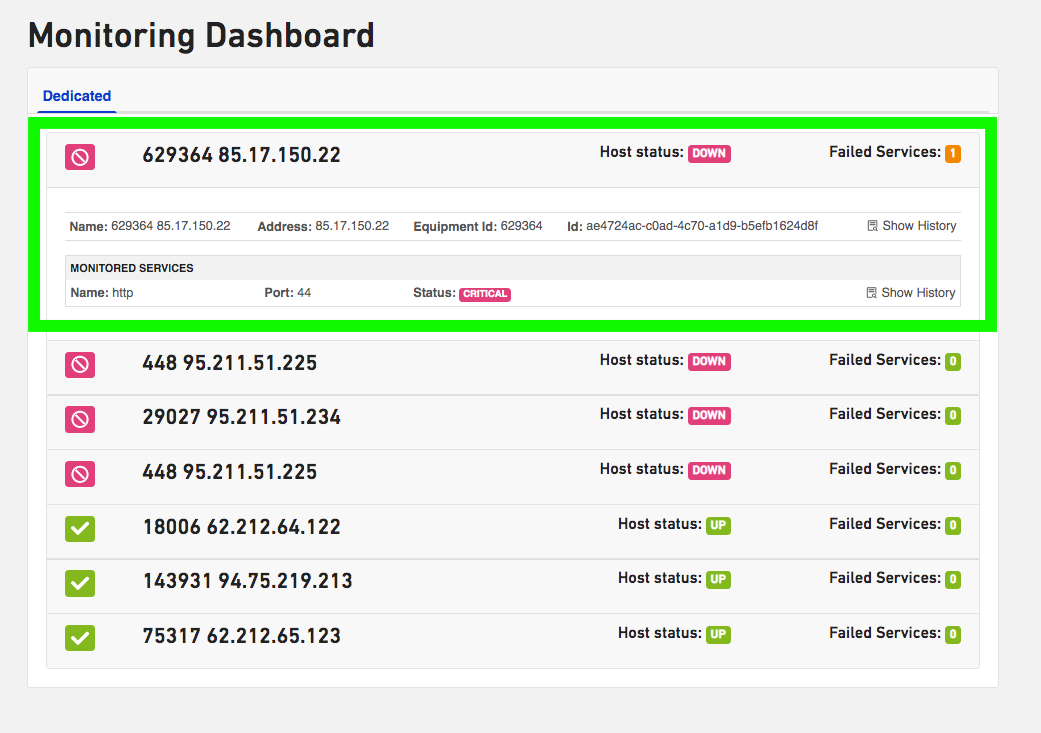
For services, the possible statuses are:
- Ok: no failing checks on this service.
- Unknown: the result of the check on this service is unknown, and after unsuccessful retries, the status will become “Critical”.
- Critical: the check on this service failed.
Checking the Monitoring History Log
For every host or service running Monitoring, you can check history logs for events that have happened in the last 30 days.
Click on the Show History link for the host or service you want to check. A popup displaying a list of past events will appear:
