The Monitoring Charts feature in vCloud is a tool designed to help our vCloud users track, analyze, and optimize resource usage. This feature gives users better visibility into their environments, enabling better management and quicker identification of performance issues.
Feature Highlights
- Real-Time Monitoring: Access live metrics for CPU, memory, storage, and network usage
- Historical Trends: Analyze data over customizable timeframes (e.g., last hour, last week)
- Interactive Charts: Zoom in, hover for detailed data points, and customize views
- Tenant-Specific Insights: Tenants can monitor their resource usage for better self-service
- Export Options: Download data for external reporting or further analysis
How to Use the Monitoring Charts
Step 1: Access the Monitoring Dashboard
Tenants:
- Log in to the Tenant Portal
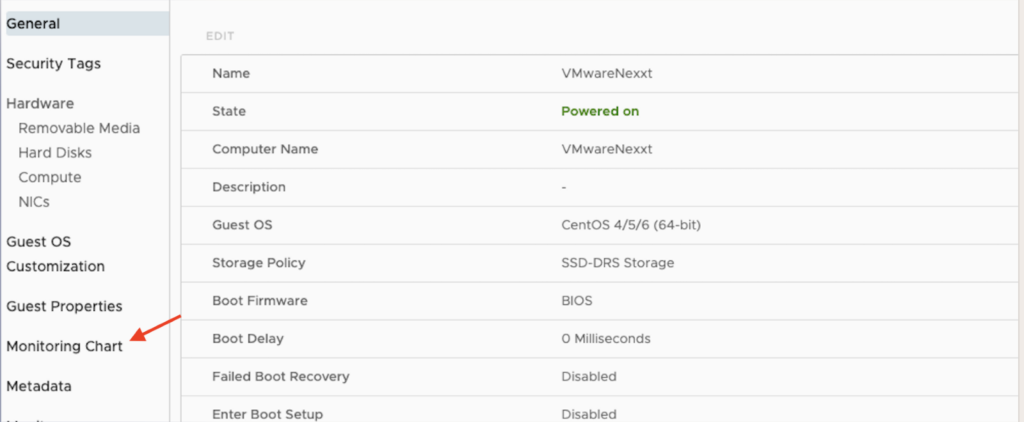
- Navigate to the VM you wish to monitor and click Action -> Monitoring Chart

Step 2: Explore Charts
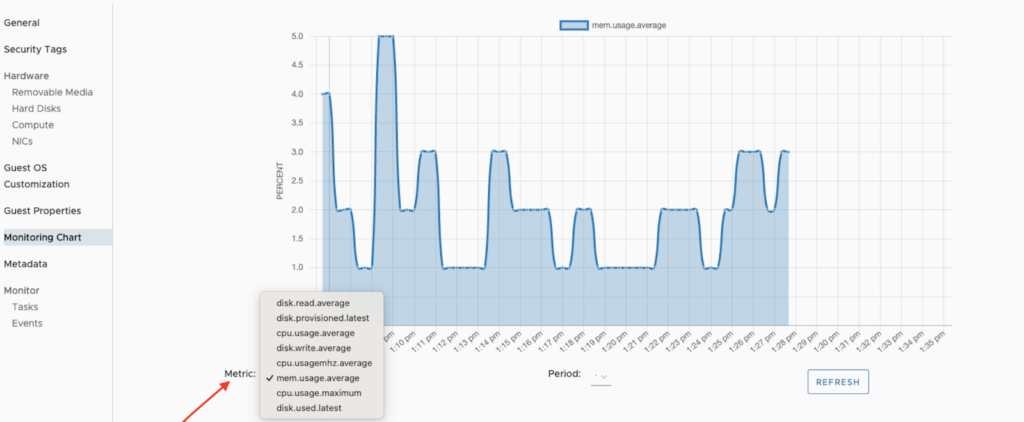
In the Monitoring section, select a category:
- Disk Read Average: Monitors the average rate of disk read operations over time
- Disk Provisioned Latest: This shows the most recently provisioned disk capacity for VMs
- CPU Usage Average: Tracks the average CPU utilization of VMs over time
- Memory Usage Average: Displays the average memory consumption of VMs over time
- CPU Usage Maximum: Captures the peak CPU usage observed within the selected timeframe
Use the time filter dropdown to select a specific timeframe (e.g., 1 hour, 24 hours, 7 days).

Step 3: Interact with Data
- Hover over Data: View precise details at specific times
- Toggle Metrics: Use the legend to enable/disable certain metrics for a cleaner view
- Adjust Views: Zoom in or out for a focused analysis