The Metrics Report page represents an overview of the total bandwidth and data traffic of your dedicated servers and aggregated packs. Please note that this page is only for informational purposes and it’s not used for billing.
If you wish to view the graphs for your aggregated pack only then please check the Aggregation Packs page, which is under the Network menu.
On the top of the page there is a feature that allows you to download the data traffic metrics in a CSV or JSON report.
The format of the report is represented in Bytes (Bps) and applies only for data traffic. By using a simple Excel conversion formula, you can convert the end results to Mbps or Gbps.
Metrics Report page
Perform the following steps to view or download the bandwidth or data traffic graphs report for your dedicated servers (and aggregated packs):
In the menu bar, under Network, select Metrics Report.

Viewing the graphs report

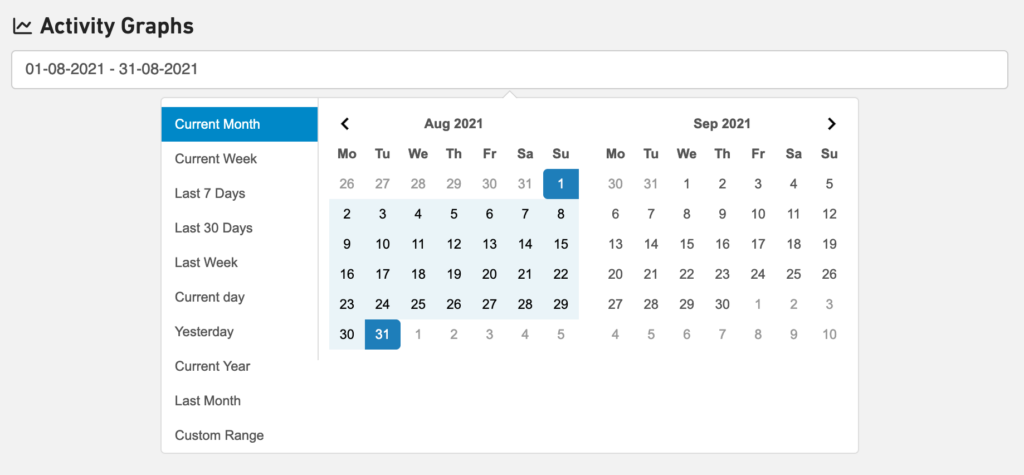
By selecting time ranges in the calendar you’re able to see the graphs for bandwidth and data traffic.

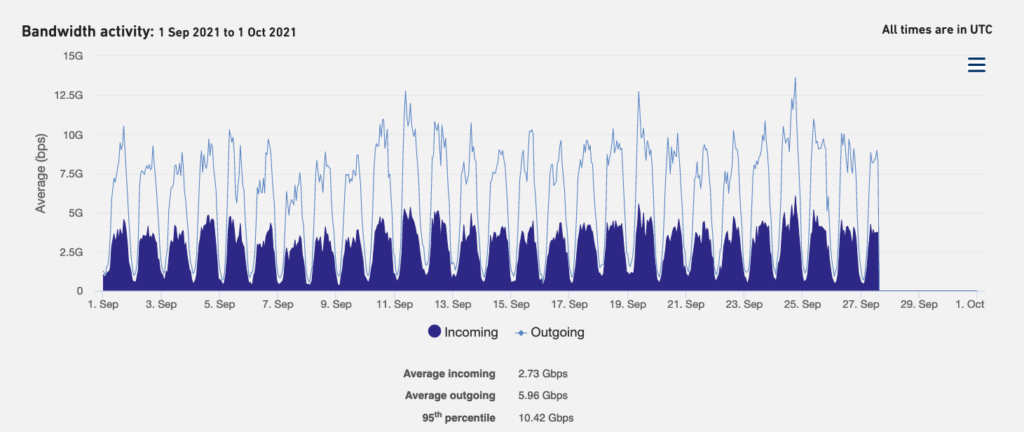
In the Bandwidth Activity graph we show the Average inbound/outbound traffic and the billable 95 percentile.
You can also zoom into specific point in time for more granularity and revert back with the ‘Reset Zoom’ button.

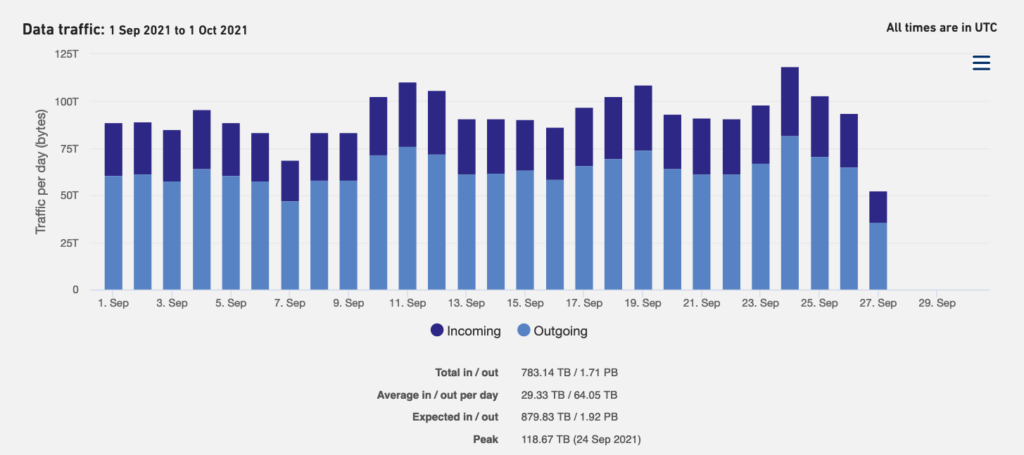
In the Data Traffic graph we show the Sum and Average of the inbound/outbound traffic. The Expected according to the Data pack and the (day) Peak.
You can also zoom into specific point in time for more granularity and revert back with the ‘Reset Zoom’ button.

